Portfolio Overview
The 60/40 portfolio is a classic investment strategy designed for steady, long-term growth with moderate risk. With a balanced allocation of 60% in stocks and 40% in bonds, this portfolio is a popular choice among investors looking for growth potential without extreme volatility. The 60/40 portfolio split between equities and bonds has historically provided stability during market downturns, while still benefiting from bull markets.
The 60% allocation typically goes into equities through an ETF like SPY, which tracks the S&P 500, giving exposure to large-cap U.S. companies. The remaining 40% is allocated to bonds, such as through the TLT ETF, which focuses on long-term U.S. Treasury bonds. This blend offers a mix of growth from stocks and defensive benefits from bonds, aiming to achieve smoother returns across various market cycles.
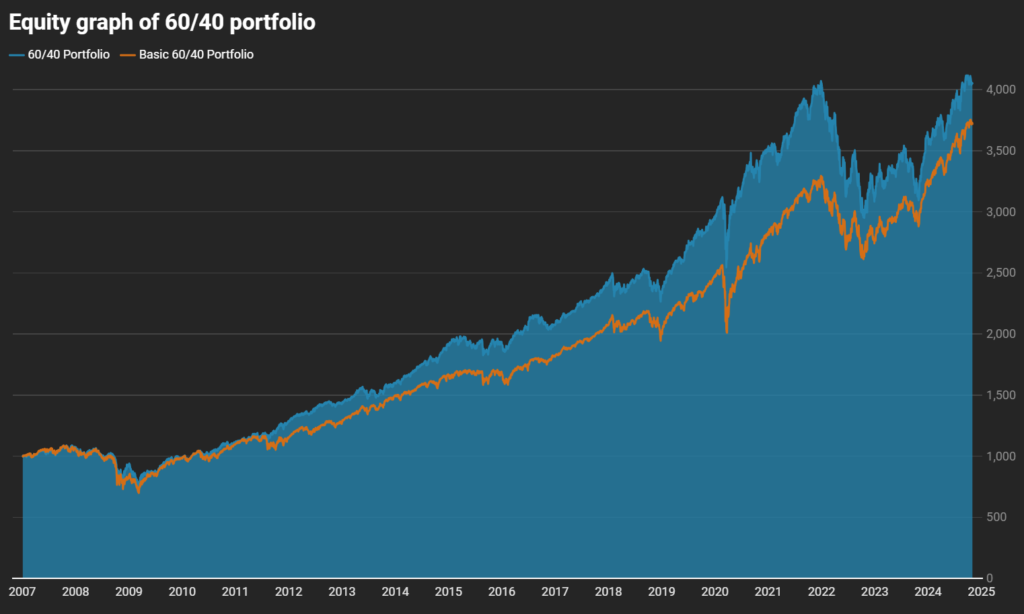
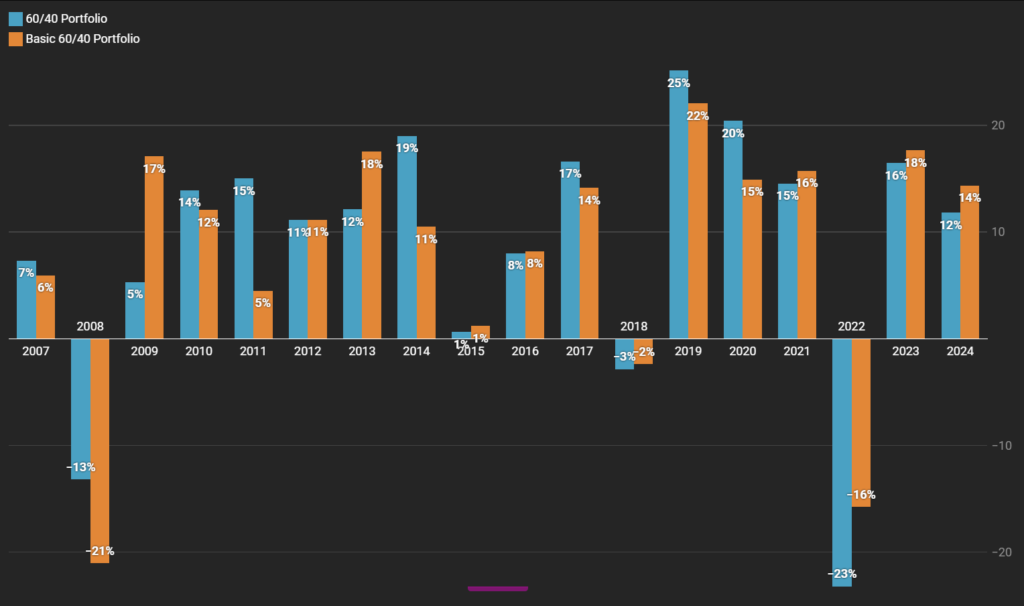
Below we compare the 60/40 Portfolio (SPY/TLT) to the Basic 60/40 Portfolio (SPY/AGG).
Real-Time Performance
We update the performance of the 60/40 portfolio every day, so you can track how it’s doing over time. Here’s a look at the most recent data:
Key Performance Metrics

| Metric | 60/40 Portfolio (SPY/TLT) | Basic 60/40 Portfolio (SPY/AGG) |
|---|---|---|
| Start Date(01/03/2007) | $1,000.00 | $1,000.00 |
| End Date(10/30/2024) | £4,052.20 | £3,720.27 |
| Annual Return (CAGR) | 8.17% | 7.65% |
| Annual Volatility | 10.57% | 10.05% |
| Max Drawdown | -31.31% | -35.69% |
| Sharpe Ratio | 0.63 | 0.61 |
| Martin Ratio | 0.98 | 1.00 |

The 60/40 portfolio (SPY/TLT) slightly outperforms the Basic 60/40 portfolio across several key metrics, making it an appealing choice for investors seeking a bit more growth potential without sacrificing too much stability. The portfolio achieved a higher annual return and additionally, demonstrated better downside protection, with a smaller maximum drawdown, indicating it was more resilient during market declines.
Asset Allocation
The classic 60/40 portfolio is a straightforward blend of two main asset classes, providing a balanced approach that adjusts well to different market environments:
- U.S. Stocks (60%): Exposure to large U.S. companies is achieved by investing in the SPY ETF, which tracks the S&P 500. This portion of the portfolio provides growth, capitalizing on the overall performance of the stock market.
- Bonds (40%): Long-term U.S. Treasury bonds, typically through the TLT ETF, offer stability and lower risk. Bonds generally perform well during periods of market stress, helping balance out the more volatile stock component.
This simple mix keeps the portfolio easy to manage while offering broad diversification. The equities provide growth, and bonds add a layer of defence, creating a more predictable investment experience over time.
Rules for the 60/40 Portfolio Strategy
Following a couple of straightforward rules allows investors to keep the 60/40 portfolio on track, minimizing risk while pursuing consistent returns.
- Initial Allocation of Portfolio Capital Begin by allocating capital with a 60% focus on equities and a 40% focus on bonds:
- SPY (60%) – Invests in large-cap U.S. companies within the S&P 500, offering equity growth.
- TLT (40%) – Allocates to U.S. Treasury bonds, providing stability and reducing overall volatility.
- Rebalancing To maintain the 60/40 balance over time, it’s essential to rebalance twice a year, realigning the portfolio to the target allocation:
- Rebalancing Steps:
- Review the portfolio’s stock and bond weights every six months. Adjust each component back to the target allocation of 60% in equities and 40% in bonds.
- Rebalancing Steps:
In Summary
The 60/40 portfolio is a tried-and-true strategy that balances growth with stability. Ideal for investors seeking moderate returns with lower volatility, this portfolio offers a straightforward way to benefit from market gains while keeping risk in check. By maintaining a consistent allocation between stocks and bonds, investors can stay invested across market cycles without needing frequent adjustments.
Overall, SPY/TLT edges out SPY/AGG in terms of growth and downside resilience, making it a strong candidate for investors willing to accept slightly higher volatility in exchange for potentially greater long-term returns.
Check back daily for updated performance metrics to track how the 60/40 portfolio is currently performing in the market.
Disclaimer
This website provides an assessment of the market and economic environment at a specific point in time. It is not intended as a forecast of future events or a guarantee of future results. The content is meant to present ideas for further research and analysis and should not be interpreted as a recommendation to invest.
This material does not provide individualized advice or recommendations for any specific reader. Forward-looking statements are subject to risks and uncertainties, and not all relevant risks related to the ideas presented may be covered. Actual results, performance, or achievements may differ materially from those expressed or implied.
The information is based on data gathered from sources we believe to be reliable. However, its accuracy is not guaranteed, it does not purport to be complete, and it should not be used as a primary basis for investment decisions.
Readers are encouraged to conduct their own due diligence and consider their individual investment objectives, risk tolerance, time horizon, tax situation, liquidity needs, and portfolio concentration. Consulting with a professional adviser is recommended to determine whether the ideas presented here are suitable for your unique circumstances.
By using the information in this article, you agree that the author and publisher are not liable for any direct or indirect losses resulting from your use of the material.